Our guide will cover…
- What is a dashboard
- What can a SEO dashboard tell you
- How do you automate SEO reporting
- How much does a SEO Reporting system cost
We’ve given examples in Google Data Studio, however these can be applied to Tableau, Power BI or any other front end as you’ll see.
What is a SEO dashboard?
SEO dashboards give at a glance answers to the most pressing questions of both practitioners and those in charge of digital marketing performance from marketing directors to managers, being:
- How is organic search performing?
- Why is it performing the way it is?
- What can be done to improve performance?
SEO practitioners will be most interested in both the performance aspects of organic search as a channel as well as the operational aspects being the technical, content/UX and authority metrics that support SEO performance.
What can a SEO dashboard tell you?
Apart from answering the above questions, they can deliver insights into your performance in visually compelling ways if designed correctly. By that I have some essential examples
Incremental value of SEO
The incremental value tells you how much SEO activity contributes to the digital marketing over and above existing activity.
The benchmark represents the organic traffic your brand would have accrued had no SEO taken place. This can be illustrated in our dashboard below:

Non Brand is the actual SEO traffic used because it represents people who are searching for something you offer without knowing who you are. This is arguably the intrinsic value of SEO because you’re creating brand awareness which adds net new users to your marketing.
Untapped SEO Performance
That’s great and what about the amount of SEO value being left on the table i.e. opportunities in the SERPs not seized upon?
Simon Dance (Chief Growth Officer, Lyst) calls it “entitlement” which I think is a good one.
Entitlement measures how much of the available search volume your site is securing for the regular organic web results and other result types such as AMP, images, videos etc.

The above shows the overall % of search clicks being captured from the available search volume. Naturally additional visuals can be provided to show this by device type (say mobile) and result type like AMP for example.
Drivers of Organic Performance
Often, as one would expect, regardless of whether organic traffic is up, down or unchanged, your stakeholders want to know why. The unfortunate problem is that data sources like analytics will either tell you how the top level channel is performing or the individual pages – but nothing in between. You get no grouping or categorisation of content to help you see which pages contributed to your SEO performance. The way to resolve it would be to apply machine learning to cluster the URLs according to the content type, like our system has below:

Here you can see which types of content are on the rise and fall, giving you an at a glance look at what content contributes the most performance.
Optimisation opportunities
Naturally, knowing what’s driving or not driving performance leads to the next question – what can be done to improve it?
One of the common and significant operational performance indicators for SEO would be to monitor how many Search Engine Result Page (SERP) cannibals you have on page 2. Usually, if you have two of your own site URLs competing for the same keyword on the 2nd page of Google’s results, the chances are the content should be merged or one of the pages need to be de-optimised, in order to get back onto the 1st page of Google. Either way, your dashboard can tell you well you’re doing on this problem over time:

From the above dashboard, you can see how many of your keywords are being cannibalised on Page 2 of Google’s SERPs.
Understanding Google Core Updates
The above notwithstanding, you may be doing a splendid job and any changes to your performance may not even be down to anything you’ve done or not done! It could be down to a core update in Google. How will we know?

Your dashboard could be set up to track the rolling variation in your competitors rankings so you can see whether the changes in your rankings are down to you alone or the market as a whole. As can be seen above, it’s quite clear everyone changes during week 25 which means there was a Google update that affected everybody as they all moved in a singular direction, and then in week 28.
Now imagine being armed with such answers in an instant.
How do you automate SEO reporting?
Going are the days of Excel reporting and SEO software where you log in and look at all your data. Especially when you consider that these systems are not sophisticated enough to keep up with the increasing questions and bespoke requirements of SEO teams.
And now with GDPR and companies wishing to maintain control of their own data, automating SEO reporting is best serviced from a cost, legal and operational point of view by having all your data in your own data warehouse driving charts in systems owned by your company.
Let’s first explain how dashboards don’t work.
How dashboards don’t work
Common to popular belief, effective dashboards that get the
level of insights shown above, don’t work by simply connecting your data sources directly into Tableau or Google Data Studio. If you attempt this you’re likely to get:
- Noisy data
- Unresponsive charts (due to the data sources crashing)
- Same old boring visuals that tell you nothing
How dashboards do work
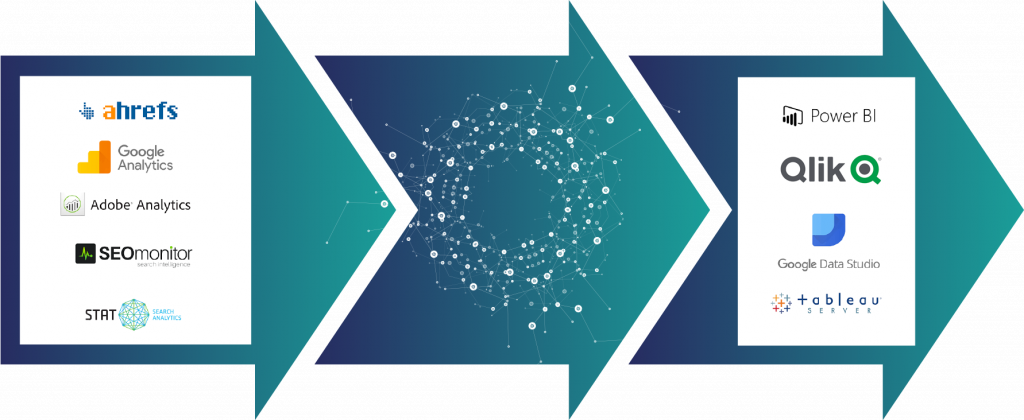
The simplest answer is ETL known as Extract, Transform and Load. To explain:

Extract – the extraction of your data from your data sources (APIs from your favourite SEO tools and analytics), usually by connecting to the APIs and then querying them for information which gets stored in the cloud.
Transform – The transformation of your data into a table that can then drive the charts that you want to display. This could be running averages of rank, sums of clicks for a page by week, anything you want. This works by taking the data extracted and then running Python in the cloud to make those calculations.
Load – once the transformations are made, the results are then stored (loaded) into a data warehouse like Google BigQuery or Amazon Redshift.
Once loaded you can push your data into Google Data Studio, Tableau, Power BI, Qlikview – whatever company has a licence for.
Your Data Sources
Fortunately, things are made much easier so that you don’t need to learn how to become a cloud data engineer. Although the data sources haven’t changed, companies like Supermetrics and Funnel.io have come along (at a cost) to provide connectors that will pipe data straight into your Google BigQuery.
Supermetrics charge approximately $200 per month per data source to get data into your data warehouse. Funnel.io will charge according to the data source type, for example $100 per month for STAT Search Analytics.
In general, your SEO intelligence system should consider all the aspects that explain and action organic performance:
Rankings
- STAT Search Analytics
- SEO Monitor
- Accuranker (warning they are limited to the top 10 SERPs)
Analytics
- Adobe
- Google Search Console
Technical
- Botify
- OnCrawl
- DeepCrawl
Authority
- AHREFs
- Majestic
- SEMRush
Keywords
- SEMRush
- Google Trends
There may be more data sources to ETL in but the above will pretty much cover it.
Your Data Warehouse
The main ones are:
- Google Cloud Platform (GCP) BigQuery
- Amazon Web Services (AWS) Redshift
BigQuery will charge $0.020 per GB storage + $5.00 per TB queries which is reasonably cheap.
Your Frontend
The main ones as mentioned are Google Data Studio, Tableau, Power BI, Qlikview. Google Data Studio has the advantage of being free while an individual licence for Tableau is around $80 per annum.
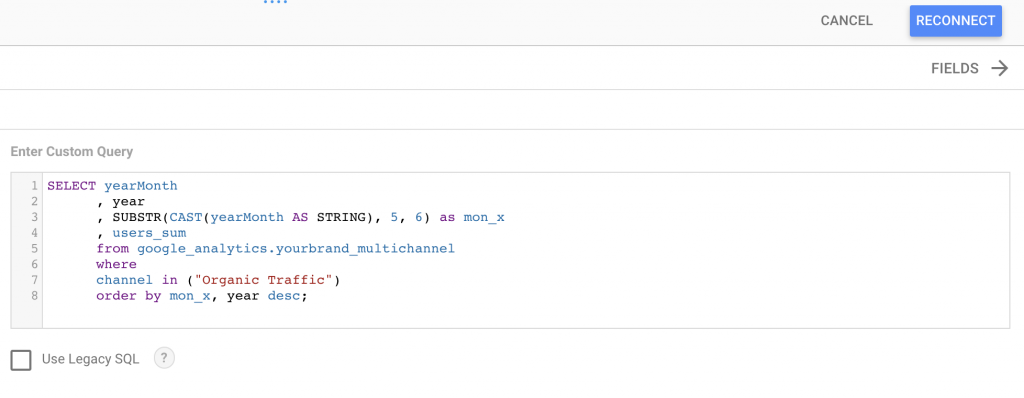
To get a graph from BigQuery (or RedShift), you simply run a SQL query in Google Data Studio and eh voila! Example shown below:

How much does a SEO Reporting system cost?
Bear in mind we’re proposing an enterprise/brand level solution
Assuming you were tracking 1,000 keywords on STAT and you wanted to include Google Analytics, Google Search Console.
The main cost components are your:
- Data source licence costs (STAT/SEO Monitor/DataForSEO etc)
- Data extraction partner (Supermetrics/Funnel.io/Artios)
- Data warehouse (AWS/GCP/Microsoft Azure)
- Front End
- Data Analyst Visualiser (hired specialist to get build the charts built)
One cost scenario using Supermetrics could look like this:
| £ Per Month | |
| Data Sources | |
| Google Analytics | 0.00 |
| STAT (Pro Rated) | 74.63 |
| Google Search Console | 0.00 |
| Data Warehouse | |
| Google Analytics (Supermetrics) | 141.79 |
| STAT (Funnel.io) | 97.01 |
| Google Search Console (Supermetrics) | 141.79 |
| Google BigQuery (Google) | 30.00 |
| Data analysis & viz | 3,000.00 |
| Total Cost | 4,485.22 |
This common scenario assumes Google Data Studio is used and that you’re tracking 1,000 keywords. Suppliers that costs for whom they are payable to are shown in brackets.
The advantage of having a data warehouse like BigQuery is that if you ever have a bespoke query, a member of your team can simply login to your BigQuery instance and run a query to get you the answers which can be piped into a Google Sheet or Data Studio or other. Example below:

The best thing about it is your numbers update automatically every week and every month, without fail (99.9% of the time) and without any staff involvement. Your team can simply focus on discussing the drivers and how to move forward:
- Create content?
- Reorganise the site structure?
SEO report automation is already here
And not some science fiction fantasy. Automating SEO reporting into dashboards is now here and under your control.
You don’t need to hire fancy cloud engineers and scientists. You simply connect your data (which you were paying for anyway, and for quite some time) into your data warehouse. There are a number of systems you can use to help automate the data ETL like Supermetrics. Naturally, Artios offer an all in one solution. Regardless of your approach to automated reporting, using third party solutions are much cheaper and quicker than using in-house full time engineers spending time to design, develop, test and maintain. After all, is your brand in the SEO automation business?
If you’d like to know more about Artios dashboard systems. Get in touch, today!
