
The digital marketing industry is constantly evolving. Content has become the currency companies and brands use to buy customers’ attention and establish lasting relationships. Knowing how to leverage content for higher engagement and better brand-to-consumer relationships is the key to unlocking growth in any contemporary sector.
Regardless of your sector, producing quality content is crucial for connecting with global audiences. However, delivering effective content can be challenging unless you know what consumers want and expect.
Conducting research into content marketing statistics can empower your brand to meet consumers’ needs more organically and impactfully.
To gain a better insight into the state of marketing in 2024, Polly assessed the sentiments of 111,887 and 8,869,464 people globally over the course of a year, ending on March 17 and March 18, 2024, respectively. Based on engagement on social media platforms like Reddit, X (previously Twitter), and TikTok, the data highlights opinions and engagement worldwide.
Let’s explore the most pertinent content marketing statistics for 2024 and see how Polly paints an accurate picture of the current landscape.
- Podcasts Get The Most Actual Engagement Online
- Podcasts Trend For Continued Growth
- Webinars, Podcasts, And Forums Remain In The Mainstream
- Women Have The Highest Digital Content Engagement Rates
- 65-Year Olds Are The Most Content Engaged Demographic Online
- The Highest Number Of People Are Viewing Content From North America
- About the Data
Podcasts Get The Most Actual Engagement Online
Over the past decade, we’ve moved far beyond mere pictures and videos as the main content types. We now have blogs, newsletters, webinars, podcasts, interviews, and more to reel consumers in and keep them entertained. But which one is the most popular of all? Let’s see what Polly says about actual engagement.
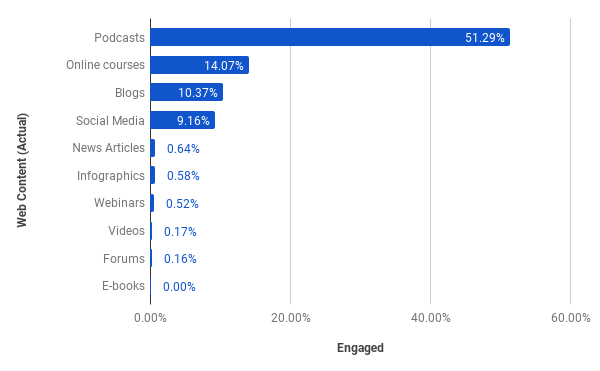
Polly’s survey overwhelmingly indicates that podcasts are the most popular (and fastest-growing) content type in 2024. With an engagement of 51.29%, many consumers seem to enjoy listening to podcasts more than they like consuming all other content types combined.
There are over 4 million active podcasts in 2024 and more than 504.9 million listeners globally.
Looking at which content types consumers were going crazy over and which were failing to grab their full attention, we can see that podcasts lead the way by almost 35%:
- Podcasts: 51.29% engagement
- Online courses: 14.07% engagement
- Blogs: 10.37% engagement
- Social media posts: 9.16% engagement
- News articles: 0.64% engagement
- Infographics: 0.58% engagement
- Webinars: 0.52% engagement
- Videos: 0.17% engagement
- Forums: 0.16% engagement
- E-books: 0.00% engagement
Knowing the hard facts about what consumers prefer engaging with is highly advantageous for any brand with big marketing goals, but how do they compare to the estimates market-watchers make about the content industry?
Polly’s pre-survey estimates projected that webinars and videos would be the most engagement-driven digital content types, with podcasts ranking third, not first, for popularity.
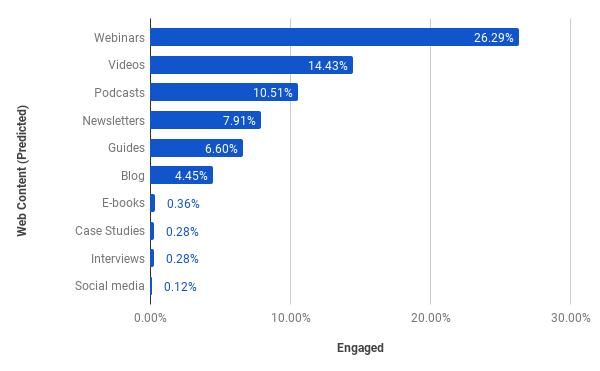
To gain a more comprehensive perspective on where content marketer’s heads are, let’s take a closer look at those estimates and how they compare to the actual engagement:
- Webinars: 26.29%
- Videos: 14.43%
- Podcasts: 10.51%
- Newsletters: 7.91%
- Guides: 6.60%
- Blogs: 4.45%
- E-books: 0.36%
- Case studies: 0.28%
- Interviews: 0.28%
- Social media posts: 0.12%
Based on this data, it’s safe to say that podcasts should not be underestimated as tools for creating strong, lasting connections with consumers. Webinars and videos remain popular as both projected favourites and practical favourites, solidifying their position in the current content marketing landscape of engagement.
Podcasts Trend For Continued Growth
Polly’s data showcases how different types of web media have gained or lost traction over the 12-month period. In the graph below, we can see how each media type has performed recently.
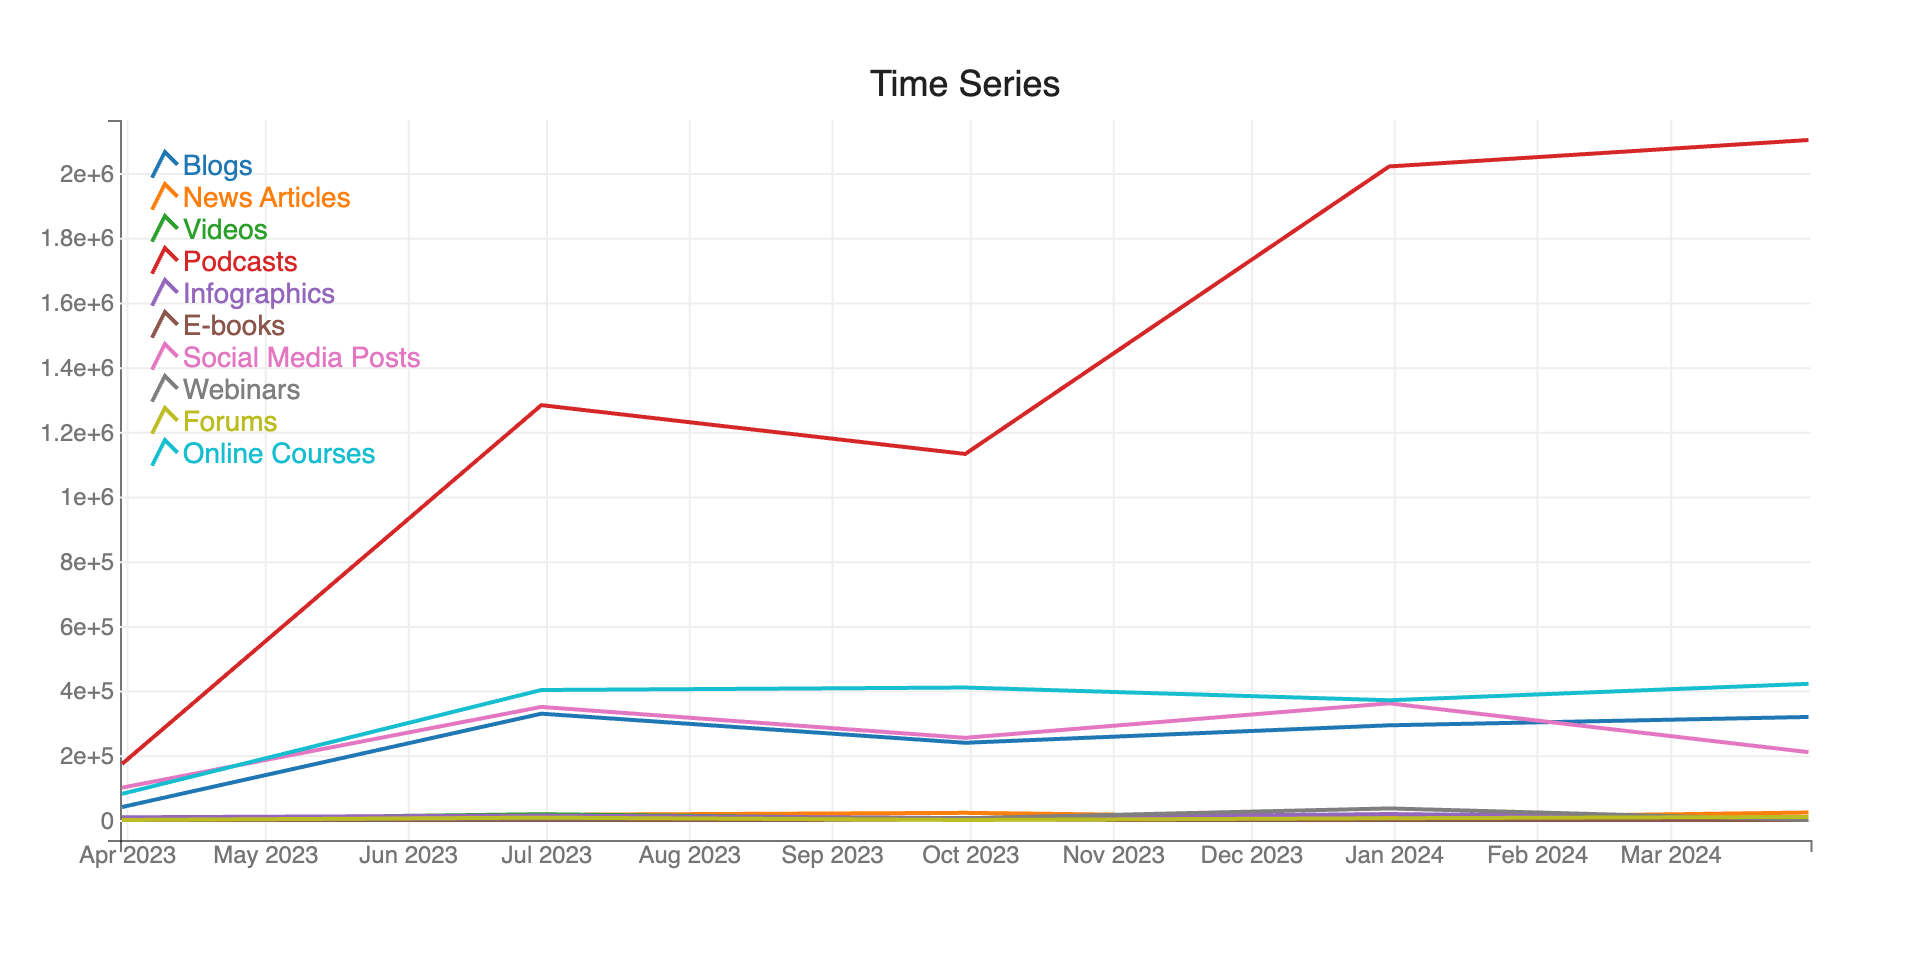
Once again, podcasts lead the way, with a massive upward trajectory that’s only dipped slightly before skyrocketing again and continuing a gentle upward climb. While not experiencing anything like the increase in popularity, online courses have fared reasonably well and have remained consistent since July 2023. Both blogs and social media posts have had their ups and downs, with blogs remaining steady from October 2023. However, social media posts have suffered a decline, dipping sharply from January 2024 to March.
News articles, videos, e-books, forums, and webinars haven’t done well in terms of upward trajectory, but they have remained consistent, which is critical for marketing, too. The more consistent a platform is, the more stability it offers.
Webinars, Podcasts, And Forums Remain In The Mainstream
Looking at new voices, it’s clear that some types of web content are stagnating while others are forging ahead and staying mainstream. The data in the graph below reveals this.
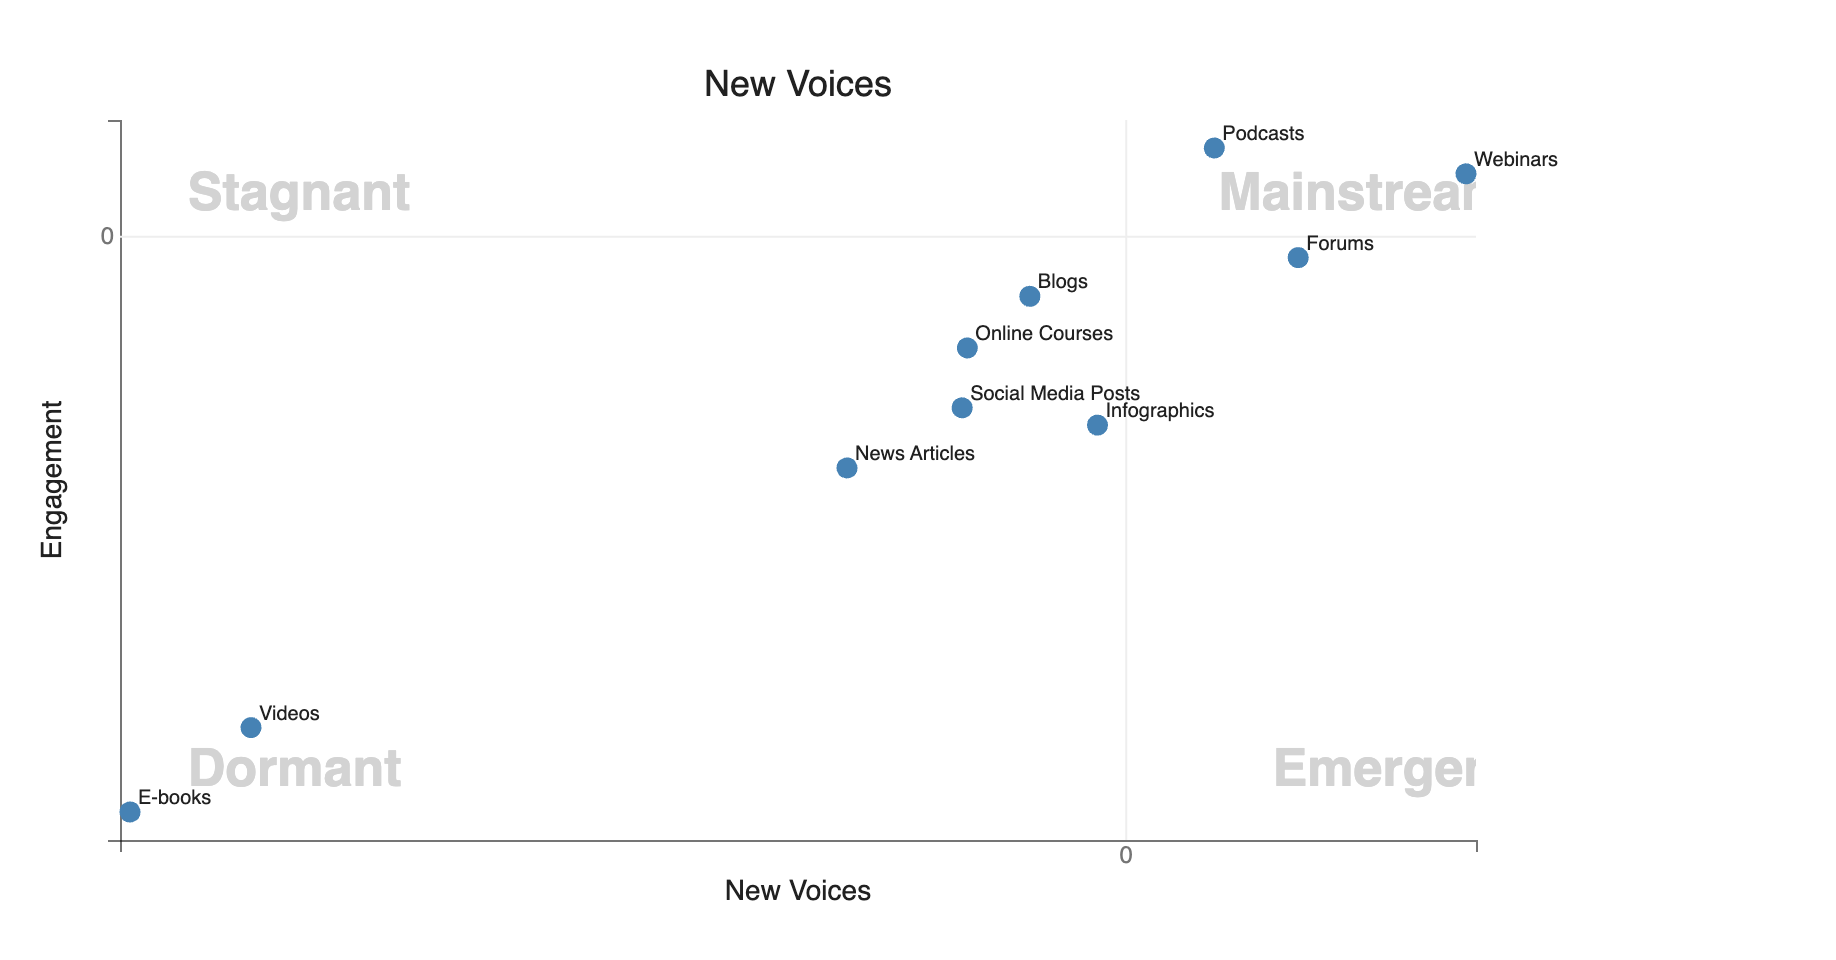
Emerging brands and long-established brands need different content marketing tactics. Unable to rely on familiarisation, new brand voices must grab consumers’ attention without any pre-existing relationship, making engagement much harder.
New brands must find the sweet spot between mainstream appeal and unique identification while steering clear of content types that tend to produce stagnant or dormant results.
However, engaging with consumers as an emerging brand is not impossible – it just requires knowing which content types consumers are most prone to exploring when it comes to new brand faces on their screens.
Polly’s data indicates that podcasts, webinars, and online forums are gaining traction and attracting new voices, while e-books, news articles, infographics, and, surprisingly, videos.
- Podcasts – Looking at all the data gathered above on the rising popularity of podcasts, it makes sense that these topics are attracting attention, becoming mainstream, and being talked about the most online.
- Webinars – 91% of B2B professionals say that webinars are their preferred type of content. These talks are enjoying mainstream interest and are certainly not stagnating.
- Forums – Community-building remains one of the most important aspects of a growing brand, and forums are highly conducive to it. The fact that these platforms attract interest and remain mainstream rather than becoming dormant or stagnating highlights their importance.
According to Polly, the content types that are stagnating are e-books, news articles, infographics, and, surprisingly, videos. These types of content can be tricky to blend into emerging marketing strategies because they typically require an already healthy community of consumers.
Podcasts, webinars, and forums work better for growing brands because they focus on community cultivation, expansion, and trust-building—exactly what emerging brands need to succeed in today’s increasingly competitive digital marketing landscape.
Now that we’ve looked at what kinds of content people are engaging with, let’s look at the gender, age, and regional demographics.
Women Have The Highest Digital Content Engagement Rates
As the graph below shows, Polly’s data indicates that women have a significantly higher engagement rate with digital content than men.
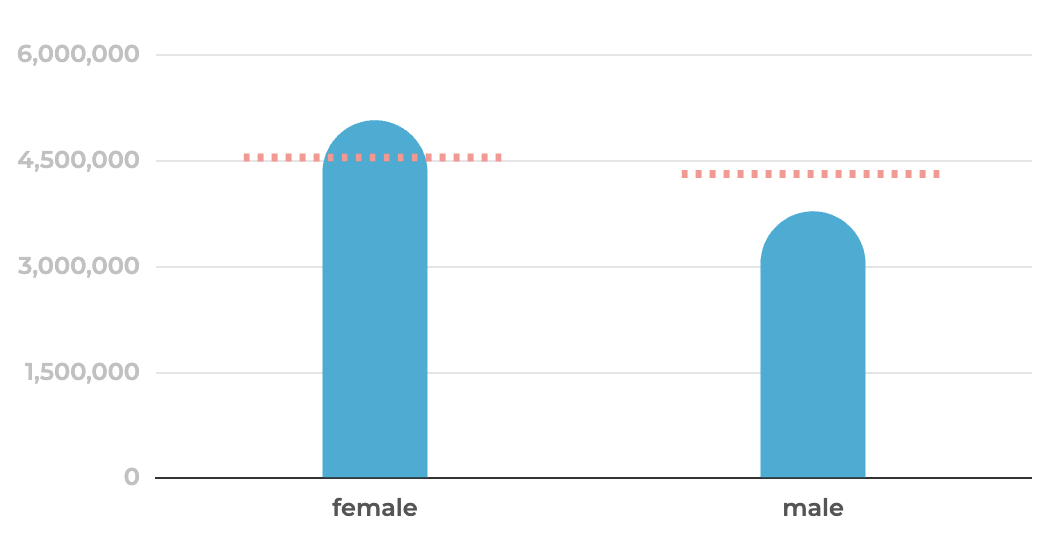
Not only does the graph illustrate that women have a higher engagement rate, as indicated by the blue line, but it is also slightly higher than expected (indicated by the red line). In contrast, men not only have a lower engagement rate overall but it’s also lower than expected.
Further studies reveal why this may well be the case. While men spend an average of 4 hours every day consuming content online, women spend about 5.5, highlighting an interesting difference in their content consumption patterns.
This trend can be further elucidated by the fact that women consume entertainment posts at a rate of 43%, roughly 10 points higher than men. Additionally, 76% of women visit or actively use a social media platform, while only 70% of men do. The sociological community suggests that this trend stems from traditionally perpetuated gender roles within the home. Historically, women have been tasked with taking family pictures and videos, which could prompt them to want to capture and upload similar content in today’s digital world.
It could also be because much of everyday consumerism is targeted at female consumers. Many of the world’s most popular e-commerce brands target female customers with their content because, historically and culturally, women are responsible for making purchases on behalf of their households, and this pattern is still largely evident today.
However, this doesn’t mean male consumers should be excluded from targeted content campaigns. Gender-neutral marketing is a growing trend that many of the world’s biggest brands are implementing for more inclusive and universally impactful content engagement.
65-Year Olds Are The Most Content Engaged Demographic Online
There may be a lot of focus on Gen Z as the driving force behind content consumption. But Polly’s data shows that, overall, people over the age of 65 are the most active content consumers online—seniors, not youngsters. Let’s unpack the graph and what it means below:
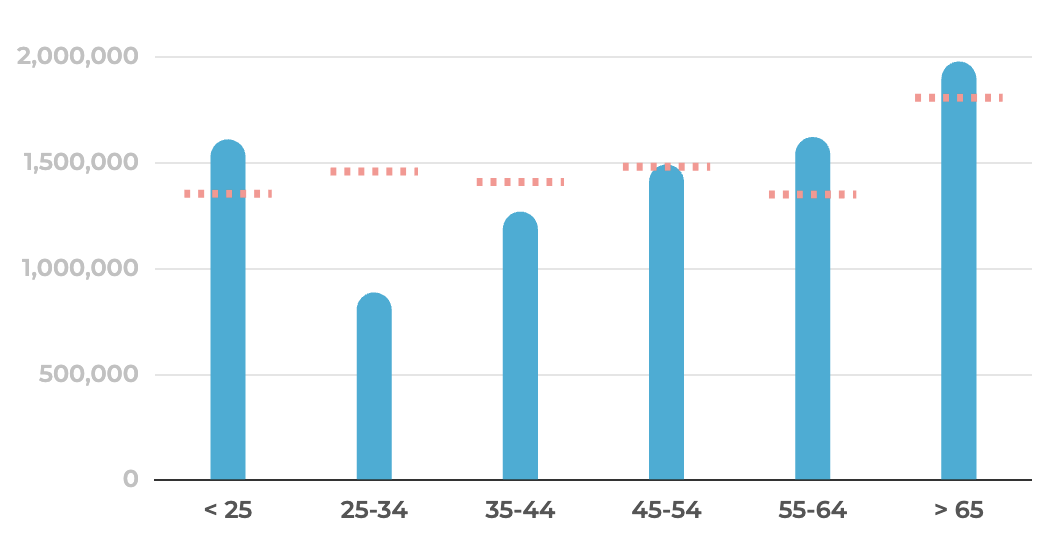
Predictions for the most content-engaged age demographic were already high for those between 55 and 64, but the data extracted from this survey found that the age range was even more active than initially projected, with almost 2 million respondents being in the retirement age bracket. The same study finds the 55-64 and under 25 age ranges to be neck and neck in terms of content consumption volume, and both age groups slightly exceed their expected engagement levels.
However, the app upon which the content is being consumed plays a major role in which age demographic is most active.
For instance, Gen Z and Millennials are the highest content consumers on Instagram, which is unsurprising because 31.8% of the people who actually use Instagram fall into the 18-24 age bracket. On Facebook, where the digital crowd tends to be a little more mature, the average user is 24-35 years old.
Polly’s survey had high expectations from the 25-34 age range in terms of overall global activity, but this age demographic ended up being the least responsive, with around just 800,000 respondents compared to 65+’s 2 million in total. The 35-44 and 45-54 age ranges slot squarely in the middle, both with marginally higher expected engagement rates than actual levels of engagement.
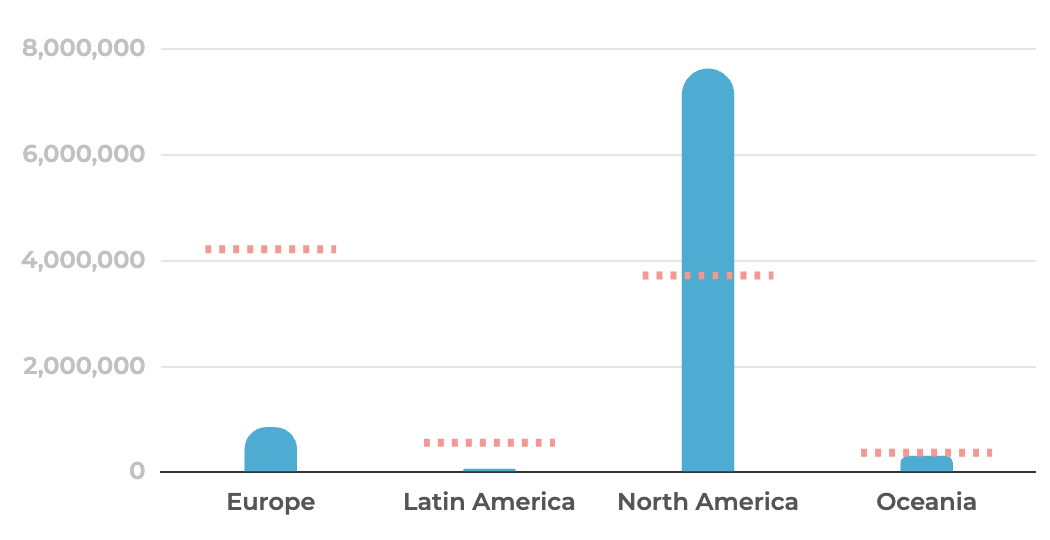
The Highest Number Of People Are Viewing Content From North America
According to the data extracted from Polly’s survey, North America is the population with the highest content-consumption. Here’s how all the countries stacked up:
Even though China has the world’s most active social media consumers (1.3 billion active users in total), the platforms used within it differ from the ones Western consumers are most familiar with today. Weibo and WeChat are China’s biggest social media platforms and comprise a huge quantity of their 1.3 billion active user population.
However, Western content consumers tend to prefer Western platforms, such as Instagram, Facebook, and TikTok. Interestingly enough, Facebook remains the most popular social media platform in Europe and the Americas, accounting for 77% of social network usage overall.
Polly predicted North America and Europe would account for similar volumes of activity (around 4 million respondents) in the digital consumer world, but the results were very different.
North America’s consumer population almost doubled expectations by reaching just under 8 million, while Europe’s consumer population amounted to less than 1 million respondents in total. Oceania’s engagement rates were almost spot-on, with the prediction of 250,000 hitting roughly 200,000, while Latin America’s response rate was almost non-existent.
However, it’s important to note that while Polly’s data has been drawn from samples of between 111,887 and 8,869,464 people across multiple social media platforms, each survey’s results have unique factors such as timing and accessibility to consider.
About the Data
The data used in this article was sourced from Polly, who created independent samples of 111,887 and 8,869,464 people from Twitter, Reddit and TikTok worldwide over a year, up until 17th and 18th March 2024. Responses were collected and analysed to produce outcomes within a 90% confidence interval and 5% margin of error. Engagement estimated how many people in the location are participating. Demographics were determined using many features, including name, location and self-disclosed description. Privacy was preserved using k-anonymity and differential privacy. Results are based on what people describe online—questions were not posed to the people in the sample.