
Most of us have done it – picked up our mobiles, typed in “{company name} reviews” and gone sifting through the experiences of others before deciding whether to part with our own hard earned cash.
Online reviews are everywhere as we approach 2024. You can review pretty much anything, from a hotel to your local plumber. For consumers, these reviews can help them to make buying decisions. But for the businesses being reviewed, they can be make or break in terms of reputation.
So just how prevalent and important are online customer reviews? We’ve surveyed the public, looked at search trends and crunched the numbers to present our round up of online review statistics for the year.
- Key Statistics of 2023
- How many consumers check online reviews during their buying journeys?
- Does Gender Influence Our Likelihood to Check Online Reviews?
- Age and Online Reviews
- Online Reviews for Big Retailers
- Most Popular Online Review Platforms
- Some Consumers Only Look for Companies with a Minimum Online Rating
- More Online Review Statistics of 2023
- Online Reputation Management Statistics of 2023
- What is Online Reputation Management?
- Online Reviews are Going Nowhere
Online Customer Reviews & Online Reputation Management: Key Statistics of 2023
If you are here for the quick version this section outlines what we consider the most important online reviews statistics of the year.
- Half of consumers in the UK check online reviews before making a purchase from a retailer they’ve never bought from before
- That represents almost double (26%) the number of consumer who’ll check social media
- People under 25 are less likely by far to check online reviews first – just over a third of this age group will check reviews, while over half of every other age group will do so
- 70% of users apply filters based on online ratings when looking for a company to shop with
- 94% have been put off making a purchase by seeing a negative review
For more fact, figures and context, read on.
How many consumers check online reviews during their buying journeys?
The short answer is yes. But let’s dive into the details.
Recently, we surveyed 2,001 people aged 16 and over in the UK and asked them:
- What sources, if any, do you check before making a purchase from a retailer you’ve never bought from before? (Tick all that apply)
- Online reviews (e.g. TrustPilot, FeeFo or similar)
- I ask friends if they’ve bought from them before
- What other people are saying about them on social media
- The company’s own social media pages
- N/A – I do not buy from any new retailers
- N/A I do not check any sources when making a purchase this way
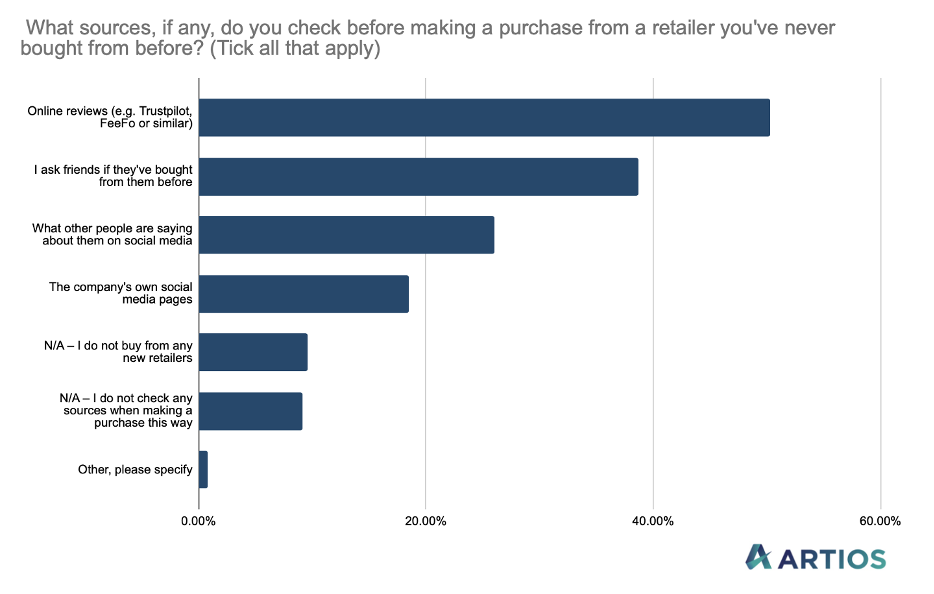
Here’s how they answered:
| What sources, if any, do you check before making a purchase from a retailer you’ve never bought from before? (Tick all that apply) | |
| Response | % of People Who Gave This Response |
| Online reviews (e.g. Trustpilot, FeeFo or similar) | 50.27% |
| I ask friends if they’ve bought from them before | 38.68% |
| What other people are saying about them on social media | 25.99% |
| The company’s own social media pages | 18.49% |
| N/A – I do not buy from any new retailers | 9.60% |
| N/A – I do not check any sources when making a purchase this way | 9.10% |
| Other | 0.80% |
A significant portion of the 90%+ of consumers who do indeed buy from retailers they’ve never bought from before will take some form of action to put their mind at ease before parting with their hard earned cash.
- Just over half of over 16s in the UK will check online reviews first
- Over a third will check with friends
- Just over a quarter will go and check out what people are saying on social media
- Fewer than 1 in 10 consumers will buy from a new retailer without checking some sources online first
So it’s incredibly clear that a significant majority of your prospective customers are checking you out online before putting their card details into your website.
Does Gender Influence Our Likelihood to Check Online Reviews?
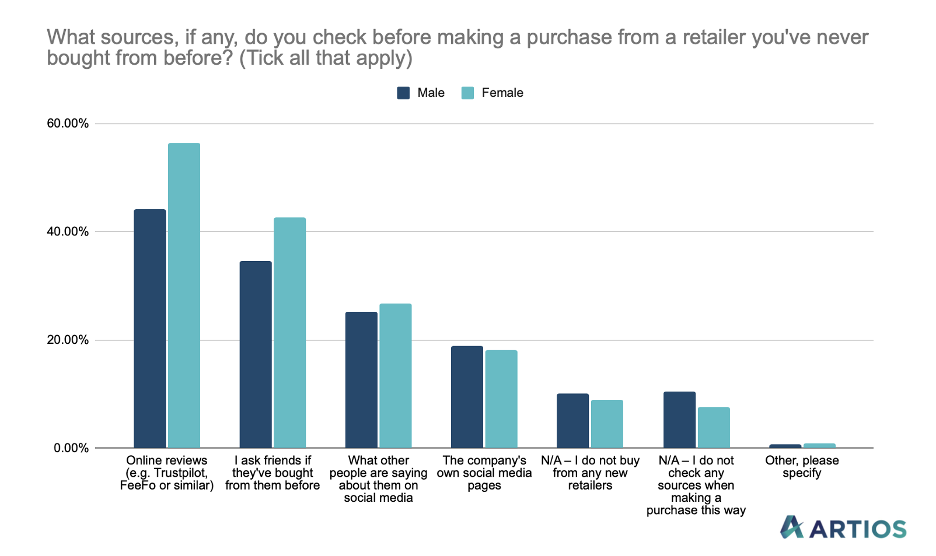
If we dive into the data a little more, we can split out our respondents by gender specified when answering the question.
| What sources, if any, do you check before making a purchase from a retailer you’ve never bought from before? (Tick all that apply) | ||
| Response | % of Men Who Gave This Response | % of Women Who Gave This Response |
| Online reviews (e.g. Trustpilot, FeeFo or similar) | 44.16% | 56.40% |
| I ask friends if they’ve bought from them before | 34.67% | 42.70% |
| What other people are saying about them on social media | 25.17% | 26.80% |
| The company’s own social media pages | 18.88% | 18.10% |
| N/A – I do not buy from any new retailers | 10.19% | 9.00% |
| N/A – I do not check any sources when making a purchase this way | 10.49% | 7.70% |
| Other | 0.70% | 0.90% |
Women are considerably more likely to check online reviews before checking out with a retailer they’ve never bought from before.
It’s a similar story when it comes to asking friends – women again being the likelier to do so.
Age and Online Reviews
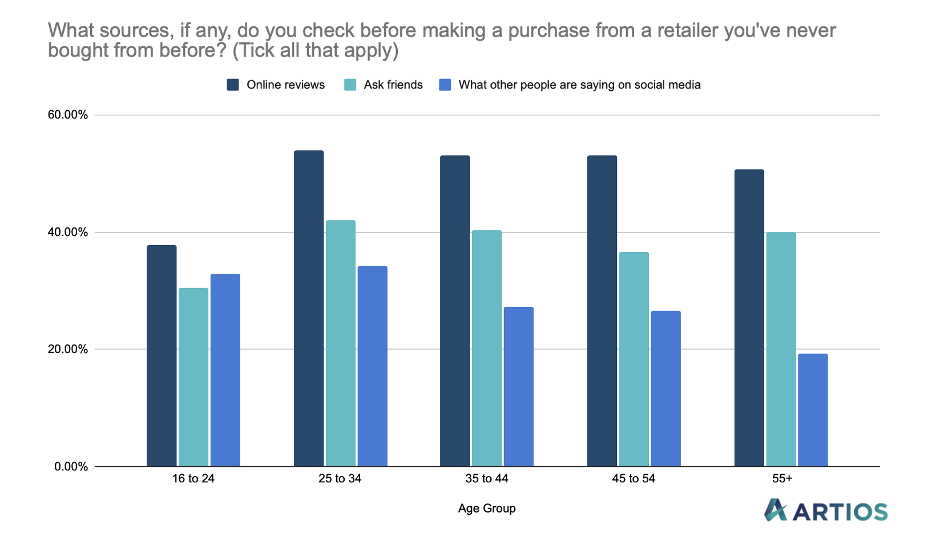
We can dive into the data and segment our respondents by age as well. When we look at the top 3 responses (check online reviews, ask friends and check social media) we see some clear variation in answers across age groups. As we enter 2024, it’s fair to say internet users span all age ranges. This is reflected in the fact that each age group is influenced, to a greater or lesser extent, by online reviews according to our statistics.
We can dive into the data and segment our respondents by age as well. When we look at the top 3 responses (check online reviews, ask friends and check social media) we see some clear variation in answers across age groups.
| What sources, if any, do you check before making a purchase from a retailer you’ve never bought from before? (Tick all that apply) | |||
| % of respondents who do this (by age) | Online reviews (e.g. Trustpilot, FeeFo or similar) | I ask friends if they’ve bought from them before | What other people are saying about them on social media |
| 16 – 24 | 37.79% | 30.53% | 32.82% |
| 25 – 34 | 53.91% | 42.03% | 34.20% |
| 35 – 44 | 53.11% | 40.37% | 27.33% |
| 45 – 54 | 53.02% | 36.58% | 26.51% |
| 55+ | 50.65% | 40.05% | 19.25% |
Younger people are significantly less likely to check online reviews before making a purchase from a retailer they’ve never bought from before.
In every single age group above 25, at least half of respondents check online reviews, according to our statistics. But in those ages 16 to 24, this number falls dramatically to 38%.
It’s a similar story when it comes to asking friends whether they’ve bought from a retailer before – the youngest age group in our survey is the least likely to do so.
But it’s the 16 to 24s and the 25 to 34s who are the most likely to check social media and find out what other people are saying there before making a buying decision.
Fewer than 1 in 5 over 55s will ever look to social media for the answers when checking up on a prospective new retailer.
Online Reviews for Big Retailers
So we know that consumers will go out of their way to look up online reviews before spending money with a lesser known retailer they’ve never shopped with before.
But what about the big brand retailers? Do consumers go looking for reviews about them?
To establish this, we went to kwfinder.com and looked at the average number of searches for the UK’s top 50 brands in 2023 for their brand plus “reviews.”
So, for example, “Amazon Reviews,” or “Asda reviews.”
We then repeated this process for each year back to 2019.
Here’s what we found:
| Keyword | 2019 | 2020 | 2021 | 2022 | 2023 |
| amazon reviews | 2317 | 3642 | 2375 | 1783 | 2600 |
| argos reviews | 590 | 1098 | 892 | 683 | 765 |
| asda reviews | 384 | 780 | 810 | 867 | 1000 |
| boots reviews | 313 | 653 | 559 | 562 | 650 |
| sainsbury’s reviews | 471 | 769 | 579 | 563 | 590 |
| tesco reviews | 2050 | 2500 | 2192 | 2067 | 2600 |
| aldi reviews | 458 | 493 | 463 | 503 | 480 |
| apple reviews | 323 | 361 | 388 | 353 | 375 |
| blacks reviews | 39 | 120 | 103 | 65 | 45 |
| dunelm reviews | 468 | 763 | 821 | 843 | 870 |
| the entertainer reviews | 147 | 68 | 62 | 58 | 40 |
| farfetch reviews | 746 | 1663 | 1367 | 1215 | 1090 |
| holland & barrett reviews | 11 | 41 | 27 | 16 | 30 |
| jd sports reviews | 250 | 734 | 525 | 318 | 210 |
| lookfantastic reviews | 1593 | 3842 | 3325 | 2433 | 1750 |
| marisota reviews | 141 | 58 | 23 | 12 | 10 |
| marks & spencer reviews | 10 | 11 | 21 | 43 | 20 |
| next reviews | 393 | 683 | 1088 | 601 | 600 |
| robert dyas reviews | 434 | 963 | 975 | 965 | 1000 |
| shoe zone reviews | 78 | 120 | 153 | 158 | 90 |
| toolstation reviews | 188 | 548 | 499 | 405 | 390 |
| urban outfitters reviews | 62 | 129 | 161 | 170 | 215 |
| yours clothing reviews | 100 | 215 | 321 | 347 | 245 |
| adidas reviews | 76 | 101 | 112 | 115 | 110 |
| b&q reviews | 337 | 488 | 375 | 344 | 375 |
| the fragrance shop reviews | 488 | 1354 | 1103 | 859 | 845 |
| h&m reviews | 123 | 177 | 161 | 145 | 160 |
| halfords reviews | 334 | 558 | 677 | 613 | 720 |
| iceland reviews | 446 | 766 | 740 | 589 | 590 |
| jack wills reviews | 53 | 90 | 61 | 61 | 80 |
| john lewis reviews | 1215 | 1325 | 1250 | 1110 | 1000 |
| jojo maman bebe reviews | 75 | 133 | 128 | 136 | 110 |
| lloyds pharmacy reviews | 114 | 195 | 248 | 380 | 420 |
| louis vuitton reviews | 28 | 46 | 57 | 43 | 70 |
| majestic reviews | 15 | 22 | 18 | 20 | 25 |
| menkind reviews | 78 | 217 | 180 | 133 | 144 |
| morrisons reviews | 294 | 618 | 537 | 503 | 535 |
| nelly com reviews | 52 | 42 | 43 | 27 | 35 |
| new balance reviews | 64 | 80 | 93 | 93 | 110 |
| new look reviews | 178 | 197 | 251 | 269 | 235 |
| phase eight reviews | 62 | 50 | 114 | 164 | 125 |
| radley reviews | 23 | 29 | 36 | 28 | 30 |
| river island reviews | 142 | 208 | 200 | 202 | 245 |
| ryman reviews | 61 | 177 | 274 | 161 | 125 |
| screwfix reviews | 208 | 290 | 297 | 391 | 490 |
| t m lewin reviews | 164 | 145 | 93 | 100 | |
| waitrose reviews | 188 | 392 | 466 | 675 | 535 |
| wickes reviews | 388 | 553 | 593 | 635 | 655 |
| wilko reviews | 197 | 358 | 237 | 193 | 210 |
| american golf reviews | 49 | 83 | 118 | 75 | 60 |
| boden reviews | 137 | 133 | 143 | 143 | 200 |
Over time, review searches for the big retailers have, in many cases, dropped slightly. Though some potential explanations for this:
- Online shopping increased dramatically over the 2020 to 2021 period owing to various lockdowns and restrictions brought about to combat the effects of the Covid pandemic.
- Arguably, better known retailers are likelier to be better trusted by consumers, resulting in them feeling less need to look up reviews
We also took a look, for the same 50 big retailers, how searches for their brand term alone compare with searches for their brand term plus “reviews.”
So, for example, when we looked at Amazon, we looked up both:
- Amazon
- Amazon reviews
We wanted to see how review searches stack up against pure brand searches.
| Brand | Pure Brand Term Searches (June 2022) | Brand + Review Searches June 2022 | Review searches as a percentage of brand searches |
| Amazon | 16600000 | 1300 | 0.01 |
| Argos | 11100000 | 590 | 0.01 |
| Asda | 6120000 | 880 | 0.01 |
| Boots | 5000000 | 480 | 0.01 |
| Sainsbury’s | 7480000 | 590 | 0.01 |
| Tesco | 7480000 | 1900 | 0.03 |
| Aldi | 3350000 | 480 | 0.01 |
| Apple | 1000000 | 210 | 0.02 |
| Blacks | 368000 | 50 | 0.01 |
| Dunelm | 3350000 | 880 | 0.03 |
| The Entertainer | 201000 | 30 | 0.01 |
| Farfetch | 165000 | 1300 | 0.79 |
| Holland & Barrett | 1000000 | 10 | 0.00 |
| Jd Sports | 2740000 | 260 | 0.01 |
| Lookfantastic | 550000 | 1900 | 0.35 |
| Marisota | 60500 | 10 | 0.02 |
| Marks & Spencer | 90500 | 40 | 0.04 |
| Next | 7480000 | 480 | 0.01 |
| Robert Dyas | 246000 | 880 | 0.36 |
| Shoe Zone | 301000 | 140 | 0.05 |
| Toolstation | 2240000 | 390 | 0.02 |
| Urban Outfitters | 673000 | 140 | 0.02 |
| Yours Clothing | 450000 | 480 | 0.11 |
| Adidas | 1000000 | 70 | 0.01 |
| B&Q | 4090000 | 390 | 0.01 |
| The Fragrance Shop | 90500 | 590 | 0.65 |
| H&M | 2240000 | 110 | 0.00 |
| Halfords | 2240000 | 590 | 0.03 |
| Iceland | 2240000 | 480 | 0.02 |
| Jack Wills | 135000 | 50 | 0.04 |
| John Lewis | 4090000 | 880 | 0.02 |
| Jojo Maman Bebe | 90500 | 70 | 0.08 |
| Lloyds Pharmacy | 673000 | 390 | 0.06 |
| Louis Vuitton | 550000 | 40 | 0.01 |
| Majestic | 74000 | 20 | 0.03 |
| Menkind | 60500 | 70 | 0.12 |
| Morrisons | 5000000 | 390 | 0.01 |
| New Balance | 450000 | 90 | 0.02 |
| New Look | 3350000 | 210 | 0.01 |
| Phase Eight | 246000 | 260 | 0.11 |
| Radley | 60500 | 10 | 0.02 |
| River Island | 1830000 | 170 | 0.01 |
| Ryman | 135000 | 90 | 0.07 |
| Screwfix | 5000000 | 260 | 0.01 |
| T.M. Lewin | 90500 | 110 | 0.12 |
| Waitrose | 1830000 | 590 | 0.03 |
| Wickes | 2240000 | 720 | 0.03 |
| Wilko | 1830000 | 140 | 0.01 |
| American Golf | 301000 | 70 | 0.02 |
| Boden | 301000 | 90 | 0.03 |
Simply put, when it comes to BIG retailers, users don’t appear particularly likely to go hunting out their reviews.
Of all the retailers in the list above, their review searches represent just 0.03% of their brand searches.
So people are 3,300 times likelier to search just for their brand term than they are for the reviews.
With that in mind, it seems a fair conclusion (alongside the fact our figures show half of UK consumers look up reviews for retailers they’ve never bought from before) that online reviews are much more of a dealbreaker for less established businesses.
Most Popular Online Review Platforms
A 2022 report found that 88% of all reviews come from just 4 platforms:
- Google My Business
- TripAdvisor
- Yelp
The top 4 doesn’t include two of the big retail centric online review platforms, TrustPilot and Feefo.
We looked at the estimated monthly searches in Google UK and globally for these 2 to look at which people look for most.
| Keyword | Average UK monthly | Average global monthly |
| TrustPilot | 353000 | 1270000 |
| FeeFo | 7700 | 11300 |
Despite its estimated 1.27 million monthly searches globally, TrustPilot still doesn’t attract anywhere near the review engagement of the likes of Google or Facebook.
Some Consumers Only Look for Companies with a Minimum Online Rating
The same report that found 88% of reviews come from just 4 sites also highlighted data about the potential impact of negative reviews.
Up to 70% of people will use filters based on average ratings when looking for retailers. In other words, people are going out of their way to only be shown products and services from businesses that have a specified minimum rating.
- Around a third of consumers filter so as not to see companies with lower than a 4 star rating
- For just over a fifth of consumers, the minimum level they set on filters is 3 stars
- A very particular 10% filter companies with less than 5 stars
More Online Review Statistics for 2024
Longing for more? Check out these quick facts and figures on online reviews!
- 94% of consumers say an online review convinced them not to make a purchase
- BrightLocal found that 98% of people read reviews when looking for local businesses
- The same study found that almost three quarters of consumers have left a review for a local business in the last 12 months
- 88% of small businesses monitor their online reputation at least quarterly
Online Reputation Management Demand
We took a look at the global searches monthly in Google UK for “online reputation management services” in January of each of 2019 to 2024. Here’s what we found:
| Month | Searches for “Online Reputation Management Services” |
| January 2019 | 1300 |
| January 2020 | 4000 |
| January 2021 | 2900 |
| January 2022 | 6600 |
| January 2023 | 1900 |
| January 2024 | 2900 |
We found:
- Demand for online reputation management services peaked in January 2022, after the major Covid lockdowns during which point more online businesses were founded
- In January 2024 there was more than double the demand for online reputation
What is Online Reputation Management?
Online Reputation Management is the process of managing a brand’s online reputation. Examples of this include influencer relations, brand image creation on social media, the use of press releases, blog posts, SEO consulting to promote favourable web results and reviews.
- 69% of people looking for jobs say they would turn down a job offer from a company with reputation problems.
- 49% of customers say they’re more likely to purchase when they receive a response on social media.
- Most Online Reputation Management solutions take between 50 to 200 hours over several months
- And believe it or not, just 15% of business executives proactively do something about their company’s online reputation!
Online Reviews are Going Nowhere
As online shopping becomes the default for many consumers, online reviews are going absolutely nowhere. Savvy shoppers are able, in just a click or two, to find out how other people found dealing with a business before they deal with that business themselves.
That’s a powerful tool for a consumer. And as for the businesses themselves, well, unless they’re lucky enough to be established brands already with a loyal happy customer base, then online reviews could be make or break for their reputation. Such reviews will often show up in search too, meaning they can influence both SEO and PPC performance.
So monitoring online reviews, actively engaging with reviewers and, of course, ensuring customers have a great experience buying from you, is absolutely critical for businesses.